Juniper Networks Junos Space Network Director
Junos Space Network Management
Click here to jump to more pricing!
Please Note: All prices displayed are Ex-VAT. 20% VAT is added during the checkout process.
Overview:
As businesses increasingly move to the cloud, there is a critical need for turnkey solutions that can help them bridge the gap between their existing environments and their vision of more agile and flexible networks that will reduce complexity and cost.
Junos Space Network Director is a next-generation network-wide management solution optimized for agility, automation, and simplicity for the cloud era. It allows users to visualize, analyze, and control the entire enterprise network-data center and campus-through a single pane of glass.
Junos Space Network Management
Juniper Networks Junos Space Network Director provides a smart, comprehensive, and automated network management solution designed for the cloud era that enables network and cloud administrators to visualize, analyze, and control their entire enterprise network-data center and campus, physical and virtual infrastructure-through a single pane of glass. In the data center, Network Director, which offers a full turnkey solution, helps administrators manage, visualize, and troubleshoot physical and virtual environments by providing correlated visibility between virtualized and physical networks, as well as flow analysis, visualization, and synchronization of network policies as virtual machines (VMs) move from server to server. In the campus, Network Director automates routine management tasks such as network provisioning and troubleshooting, dramatically improving operational efficiency and reliability.
Network Director incorporates key functions that address the challenges posed by the rapid adoption of virtualized, dynamic, and on-demand cloud services across data center and cloud deployments. In addition, Network Director offers sophisticated end-to-end network visibility and flow path analysis in conjunction with the Juniper Networks Cloud Analytics Engine, providing flow-aware performance analysis to improve application performance and availability by associating flows/applications across the physical and virtual infrastructure, improving the ability to quickly roll out new applications and troubleshoot problems.
These smart network management capabilities are delivered through the following key features.
Automate
- Fabric automation fully automates the provisioning, configuration, and deployment of complex underlay and virtualized fabric topologies, providing comprehensive preand post-deployment support and management for Layer 2 and Layer 3 fabrics, as well as Junos Fusion Enterprise fabrics. Junos Fusion is a single-tier architecture that allows an enterprise network to be managed as a single system.
- Zero touch provisioning (ZTP) simplifies the deployment of networks without requiring user intervention, providing policy-driven plug-and-play provisioning and network bring-up operations for both fabrics and individual devices.
- Bulk provisioning enables faster service rollout and activation while protecting against configuration errors with profile-based and pre-validated configurations. Bulk operations can be performed at logical (access, aggregation, core) or location (site, building, floor, rack) levels.
- Automated access port provisioning supports plug-and-play operations. Network Director detects the end point device types (such as wireless access points and VoIP phones) that are plugged into ports and automatically provisions all port-related parameters including VLAN, 802.1x, and security policies to comply with port profiles.
Analyze
- Performance Analyzer provides real-time and trended monitoring of tenants, hosts, VMs, fabrics, and ports, as well as high-frequency monitoring that gathers valuable performance data for tracking queue depth and heat-map visualization. Network Director analyzes the entire network, using heat-maps to identify over- and under-utilized ports, latency, and top VMs, users, devices, and ports.
- Network Traffic Analyzer proactively monitors network usage to find the sources of network traffic spikes. Incorporating an automated policy-driven sFlow collector and flow analysis, Network Traffic Analyzer quickly identifies and isolates users, applications and protocols consuming the most bandwidth.
- Flow Path Analyzer provides operational and diagnostic capabilities that trace connectivity between applications and flows by correlating network telemetry data with the application. Flow Path Analyzer visualizes network paths between leaf and spine switches for a given flow/ application, correlating congested ports with high-latency events and identifying impacted or unhealthy VMs, applications, and hosts.
- Overlay and Underlay Analyzer provides full visibility, performance management, and troubleshooting capabilities for physical and virtualized overlay networks in VMware Virtual Extensible LAN (VXLAN) and controller-less environments. It provides a consolidated and correlated view of VMs, hosts, fabrics, and overlay and underlay networks with full end-to-end network and flow visibility and analysis.
- VM Analyzer provides real-time physical and virtual topology views, tracks vMotion activity including virtual machine creation, deletion, and moves, and maintains complete virtual network inventory.
- Fabric Analyzer monitors and analyzes the health of the entire network fabric, including IP Fabric, Virtual Chassis Fabric configurations, and Juniper Networks QFabric System, increasing service availability.
Features and Benefits:
End-to-End Network Visibility and Flow Path Analysis
Working in conjunction with the Cloud Analytics Engine, Network Director provides network data analysis to improve application performance and availability by associating flows with specific applications across the physical and virtual infrastructure, improving the ability to quickly roll out new applications and troubleshoot problems (see Figure 1).
Network Director analyzes and visualizes application flows running on VMs and bare-metal servers in the data center, reporting the specific path a flow takes through the network, the latency encountered at each hop, and traffic statistics for every network device in the path. Users can start flow analysis on selected active flows on a specific VM or a non-virtualized host on demand and view the results. When users place a critical VM or non-virtualized host on a watch list, Network Director will automatically initiate analysis on all flows running on that device.
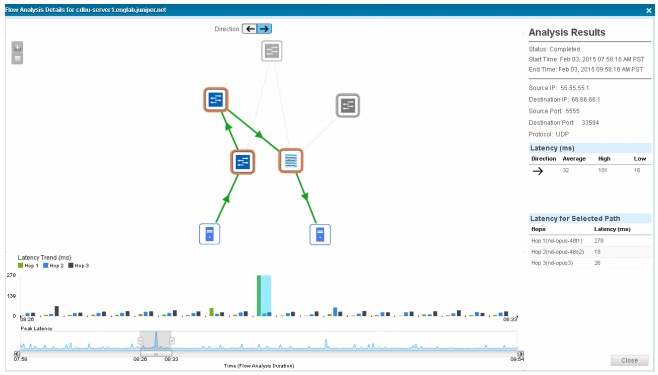
Figure 1: Flow path analysis
Network Traffic Analyzer
The Network Director Network Traffic Analyzer gathers detailed information about network bandwidth usage patterns on each switch port, allowing network administrators to make informed policy and planning decisions about specific applications and ports. Using an automated, policy-driven sFlow collector and flow analysis, Network Traffic Analyzer identifies which users, applications and protocols are consuming the most bandwidth, helping network administrators identify the source of network spikes and bursts to proactively monitor, control and manage network usage (Figure 2).
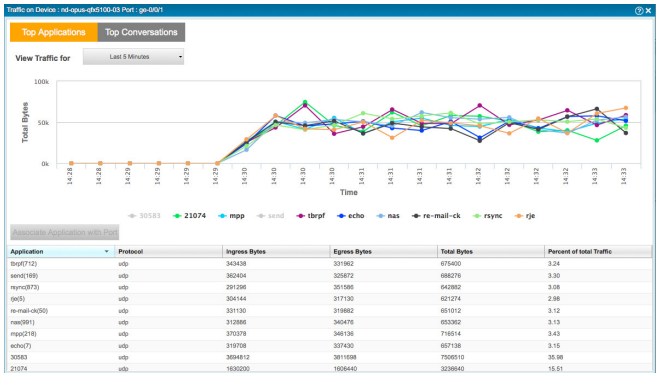
Figure 2: Network Traffic Analyzer
Integration with Virtualized and Cloud Infrastructure
Network Director integrates with virtualized and cloud infrastructure tools, providing network and cloud administrators with a comprehensive view of the complete data center infrastructure.
Network Director Management Pack for vRealize Operations provides comprehensive visibility into Juniper infrastructure and VMware virtual networking services deployed in a vSphere environment, including virtual machines (VMs), hosts, and network elements such as switches and switch fabrics. Virtual administrators and network operations managers will be able to determine at a glance the health, capacity and performance of these objects, helping them quickly remediate problems that impact virtual machine connectivity and performance (Figure 3).
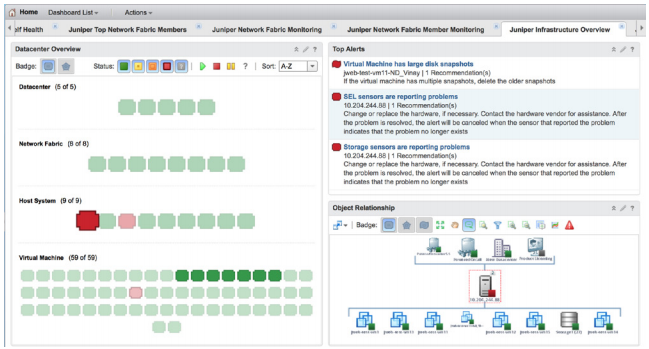
Figure 3: Juniper Management Pack main dashboard
Network Director also provides holistic and correlated visibility into enterprise and private cloud data centers comprised of physical (underlay) fabrics and virtualized networks (see Figure 4), as well as virtualized and non-virtualized hosts encompassing the following deployments:
- VMware vCenter-Network Director unifies physical and virtual networks, providing a comprehensive view of the complete end-to-end virtual-to-physical network infrastructure. It integrates with VMware vCenter, delivering a combined solution that benefits from both vendors' innovation and from Juniper's orchestration solutions to discover, visualize connectivity between virtual and physical networks, orchestrate, and monitor VMware vSphere environments.
- VMware NSX and OpenStack-Network Director integrates with cloud infrastructure controlled by VMware NSX SDN Controller environments and OpenStack. Through this integration, Network Director provides complete and correlated visibility between virtualized and physical networks as well as virtual machines, VXLAN, virtual tunnel endpoints, and OpenStack networks with full end-to-end network and flow visibility and analysis (Figure 4).
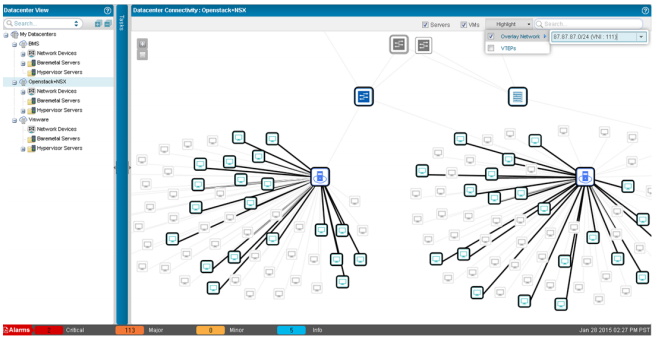
Figure 4: Virtualized (overlay) and underlay network visibility
In addition to virtualized and cloud infrastructure deployments mentioned above, Network Director also includes support for non-virtualized servers (also called bare-metal servers).
Fabric Automation and Management
Network Director provides comprehensive pre- and postdeployment (Day 0 through Day 2) plug-and-play fabric automation and management for Layer 2 and Layer 3 fabric topologies. It fully automates fabric-wide provisioning, configuration, and deployment of complex fabric topologies comprised of multistage spine-and-leaf switches, eliminating errors associated with manual deployment (see Figure 5). As part of the pre-deployment automation process for Layer 3 fabrics, Network Director provides simple-to-use workflows to set up fabric switches, assign protocol settings, perform BGP IP address configuration and cabling, and set up ZTP servers for plug-andplay operations.
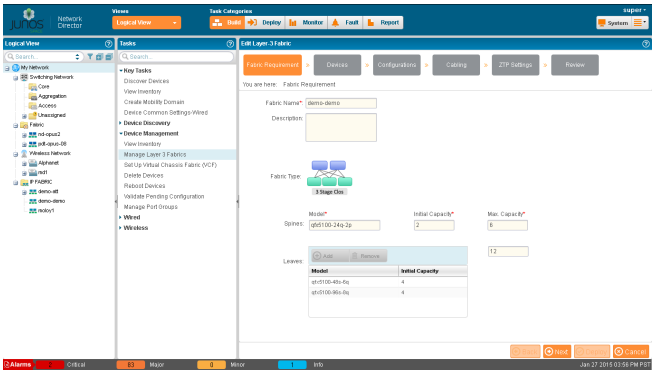
Figure 5: Fabric automation
Network Director also automates the discovery of fabrics and all of their associated switches. In addition, it performs cabling checks to ensure that all devices are connected per the initial design.
Controller-Less Network Virtualization
As networks grow more flexible and agile, enterprises are turning to network virtualization in the data center to increase cost effectiveness and gain a competitive edge. Network Director completely automates the creation and management of overlay fabrics on top of Layer 3 IP fabrics (underlay networks) utilizing an Ethernet VPN (EVPN) control plane and VXLAN-based overlay topology. The process follows a simple workflow that includes:
- Defining and mapping tenants to VRFs and VXLANs
- Defining tenant segments and mapping those segments to VLANs and VXLAN associations
- Multihoming server settings
- Associating gateways for tenants
- Providing full visibility into each tenant and overlay network, as well as correlated views of overlay and underlay networks
Multipoint Navigation and Views
Network Director improves operational efficiency by allowing users to manage the network from different views, groupings, and perspectives. It includes a customizable dashboard that provides a visual indication of overall network usage and network consumers, including VMs, hosts, top virtual networks, flow analysis, utilization, latency, top talkers, and alarms-all presented as part of a color-coded heat map representing devices and ports. Each device is color coded to convey the level of port utilization and latency; “cooler” colors indicate lower port utilization and latency while “hotter” colors indicate higher port utilization and latency (see Figure 6).
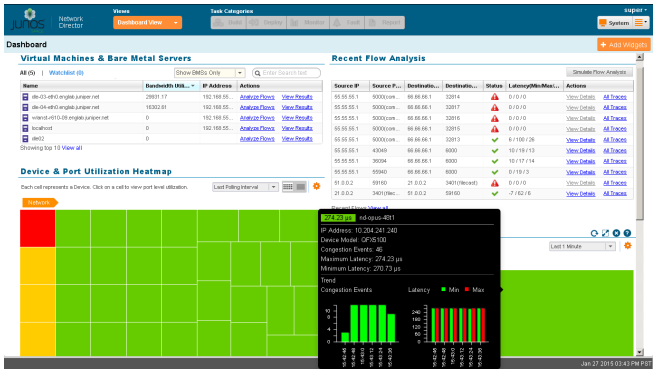
Figure 6: Dashboard view
In addition, Network Director Topology view shows all discovered devices in the network on a map where the devices are located across sites, buildings, floors, closets, and racks, along with their physical connections to other devices in the network. Topology view also shows the physical and logical connectivity between various discovered interconnected devices. Topology view allows users to zoom in or out of a site, see how a device is connected to its immediate neighbors, including VMware hosts connected to the switch, or view alarm details, bandwidth of links, and realtime link data and state of the devices. Network Director also enables devices to be rearranged across buildings on the map.
Specifications:
Network View and Device Selection
- View devices grouped by logical relationships, locations, device type, custom group view, data center view, or topology view
- Select logical, location, device-type, custom group, virtual, or topology view groupings to perform tasks on multiple devices simultaneously
- Search for devices in the network
- Define filters to selectively view specific logical, location, device-type, custom group, virtual, or topology groupings
Data Center Management
- Fully automated plug-and-play underlay fabric topologies
- Controller-less: Build virtual networks on top of IP fabric underlays without SDN controller utilizing EVPN/VXLAN • SDN integration: Discover virtual networks with VMware NSX SDN controller
- Automatically orchestrate physical switches based on vMotion
- View hosts, virtual switches, virtual machines, virtualized networks, and virtual tunnel end points (VTEPs)
- View tenants, virtualized networks, and all underlay fabric resources
- View connectivity between VMs, virtual switches, physical switches, and virtualized networks
- View vMotion history, VM and host bandwidth utilization
- Compatible with VMware vCenter versions 4.1, 5.0, 5.1, and 5.5
- Compatible with VMware vSphere versions 4.0, 4.1, 5.0, 5.1, and 5.5
- Compatible with VMware NSX 6.0, 6.1, and 6.2.0
- Compatible with OpenStack Kilo, Liberty, Mitaka, and Newton
VMware vRealize Operations Management Pack
- Management Pack provides:
- Health dashboard for networking and compute to cloud administrators
- Correlated view of virtual and physical network components to cloud administrators
- Physical network capacity management and planning
- Main dashboard widgets-Data Center Overview, Top Alerts, and Object Relationship-display all data centers, underlying fabrics, host devices, and virtual machines that are part of the data center network
- Fabric and fabric members (spine/leaf) dashboards monitor Juniper Fabric topologies such as Virtual Chassis, QFabric Systems, Layer 3 fabrics, and Virtual Chassis Fabrics that are part of the data center. Dashboard widgets display data center fabrics, CPU and memory utilization history, and forecast widgets.
- Top Fabrics and Fabric Members dashboard enables cloud administrators to view and identify potential performance issues in the data center, identifying top fabrics by CPU and memory utilization, top noisiest fabrics based on Alerts widget, and top volatile fabrics based on Metrics widget. Clicking on a row provides more details about that fabric and possible causes, If any, for the vulnerability of the fabric.
Configuration Profiles
- Create, edit, or delete the following profiles:
- Access profile (EX Series Ethernet Switches and MX Series 3D Universal Edge Routers [LAN])
- Authentication profile (EX Series)
- Class-of-service (CoS) profile (EX Series, QFX Series, QFabric System, and MX Series [LAN])
- Device basic settings profile (EX Series, QFX Series, QFabric System, and MX Series [LAN])
- Filter profile (EX Series, QFX Series, QFabric System, and MX Series [LAN])
- Port profile (EX Series, QFX Series, MX Series [LAN] and QFabric System)
- Quick templates to setup smaller deployments
- Auto profile provisioning based on policy
- VLAN profile (EX Series, QFX Series, QFabric System, MX Series [LAN] and WLC Series)
Deploy Mode Features
- Configuration changes
- View pending configuration changes and validate changes before deploying configuration on devices
- Automatically deploy changes on selected devices immediately or at a scheduled time
- Set SNMP configuration
- Port channelization and conversion
- Manual Approval mode requires device configuration changes to be explicitly approved
- View deployment results and manage configuration deployment jobs
- Software images
- Maintain a repository of software images for switches and wireless LAN controllers
- Deploy selected images on selected devices immediately or at a scheduled time
- View deployment results and manage image deployment jobs
- Resynchronize configuration
- Resynchronize the saved device configuration with the configuration on the device
- Configuration file management
- Back up and restore device configuration files
- Configuration and image baselining
- Audit configuration changes and image files and send notification in the event of unauthorised changes
Monitor Mode Features
- Traffic monitoring (view the following for traffic on switches and wireless LAN controllers):
- Fabric and fabric members (spine and leaf) utilization
- Network Traffic Analyzer
- Fabric Analyzer for Virtual Chassis Fabric and QFabric System
- Top VMs by bandwidth utilization
- Host network interface card (NIC) bandwidth utilization
- Virtual switch summary by version
- VM bandwidth utilization trend
- Distribution of mobile devices
- Current mix of unicast, multicast, and broadcast packets and trends over time
- Port traffic trend and error trend
- Current port utilization and trend
- Equipment status
- System information (view the following):
- Device status and information
- CPU and memory usage
- Fan and power supply status
- Port status
- System information (view the following):
Fault Mode Features
- Alarm monitoring
- Correlate low-level faults into easy-to-understand alarms
- View current counts of critical, major, and minor alarms (always visible in user interface)
- View alarms for selected scope by category, severity, and state
- View individual alarm details
- Search for an alarm
System Mode Features
- Audit trail and job management
- View audit trail of Network Director user and system activity
- View and manage all jobs
Supported Platforms:
| Supported Platforms | Operating System |
|---|---|
| QFX Series Ethernet Switches QFX5100 Virtual Chassis Fabric |
Junos OS releases 14.1X53-D27, 14.1X53-D15, 13.2X51-D20, 14.1X53-D40 |
| QFX10002 | 15.1X53-D61 |
| QFX 10002 IP Fabric (Spine) EX4300 (Leaf) QFX5100 |
15.1X53-D61 14.1X53-D40 |
| QFX10008 IP Fabric (Spine) QFX5200 IP Fabric (Spine and Leaf) QFX5100 |
15.1X53-D33 15.1X53-D210 14.1X53-D40 |
| QFX3500/QFX3600 (non ELS) | 12.3X50-D35 and 12.3X50-D40 |
| QFX3500/QFX3600 ELS and Virtual Chassis | 13.2X51-D30 |
| QFX5100-24Q, QFX5100-48S, QFX5100-96S ELS and Virtual Chassis | 14.1X53-D15, 14.1X53-D27, 14.1X53-D40 |
| QFX5100-48T | 14.1X53-D40 |
| QFabric Systems (QFX3000-G and QFX3000-M) | 14.1X53-D15, 13.2X52-D20, 14.1X53-D17 |
EX Series Ethernet Switches:
|
Junos OS releases 11.4, 12.1, 12.2, 12.3, 13.2X50-D10, 13.2X50-D15, 13.2X51-D15, 13.2X51-D20, 13.2X51-D30, 14.1X53-D15, 14.1X53-D25, 15.1R1, 14.1X53-D35, 14.1X53-D40.8 |
EX Series Ethernet Switches with ELS:
|
Junos OS releases 13.2X51-D15, 13.2X51-D20, 13.2X51-D30, 14.1X53-D27 |
| EX4600 Standalone and with Virtual Chassis technology | Junos OS release 13.2X51-D25, 14.1X53-D27 |
| EX9200 | Junos OS releases 13.2R1, 13.2R2, 13.3R2, 14.1R4, 14.2R2, 15.1R1 |
| MX Series 3D Universal Edge Routers MX240, MX480, MX960 (ELS) | Junos OS releases 13.2R2.4, 14.1R4, 14.2R2, 15.1R1 |
| MX80, MX104, MX240, MX480, MX960 (non-ELS) | Junos OS release 14.1R4, 15.1R1 |
| VMware vCenter Server | vCenter 5.0, 5.1, 5.5, 6.0 |
| VMware vRealize Operations | 6.0, 6.1, 6.2 |
| VMware ESXi | VMware ESXi versions 5.0, 5.1, 5.5 and 6.0 |
| OpenStack | Supported release-Kilo, Liberty, Mitaka, Newton |
| VMware NSX -V | Version 6.2 Version 6.1 Version 4.1 |
Documentation:
Download the Juniper Networks Junos Space Network Director Data Sheet (PDF).
Pricing Notes:
- All prices displayed are Ex-VAT. 20% VAT is added during the checkout process.
- Pricing and product availability subject to change without notice.